User Guide
Updated 2026-03-13
Analytics Overview
Explore team performance, customer engagement, and business analytics.
Analytics Overview
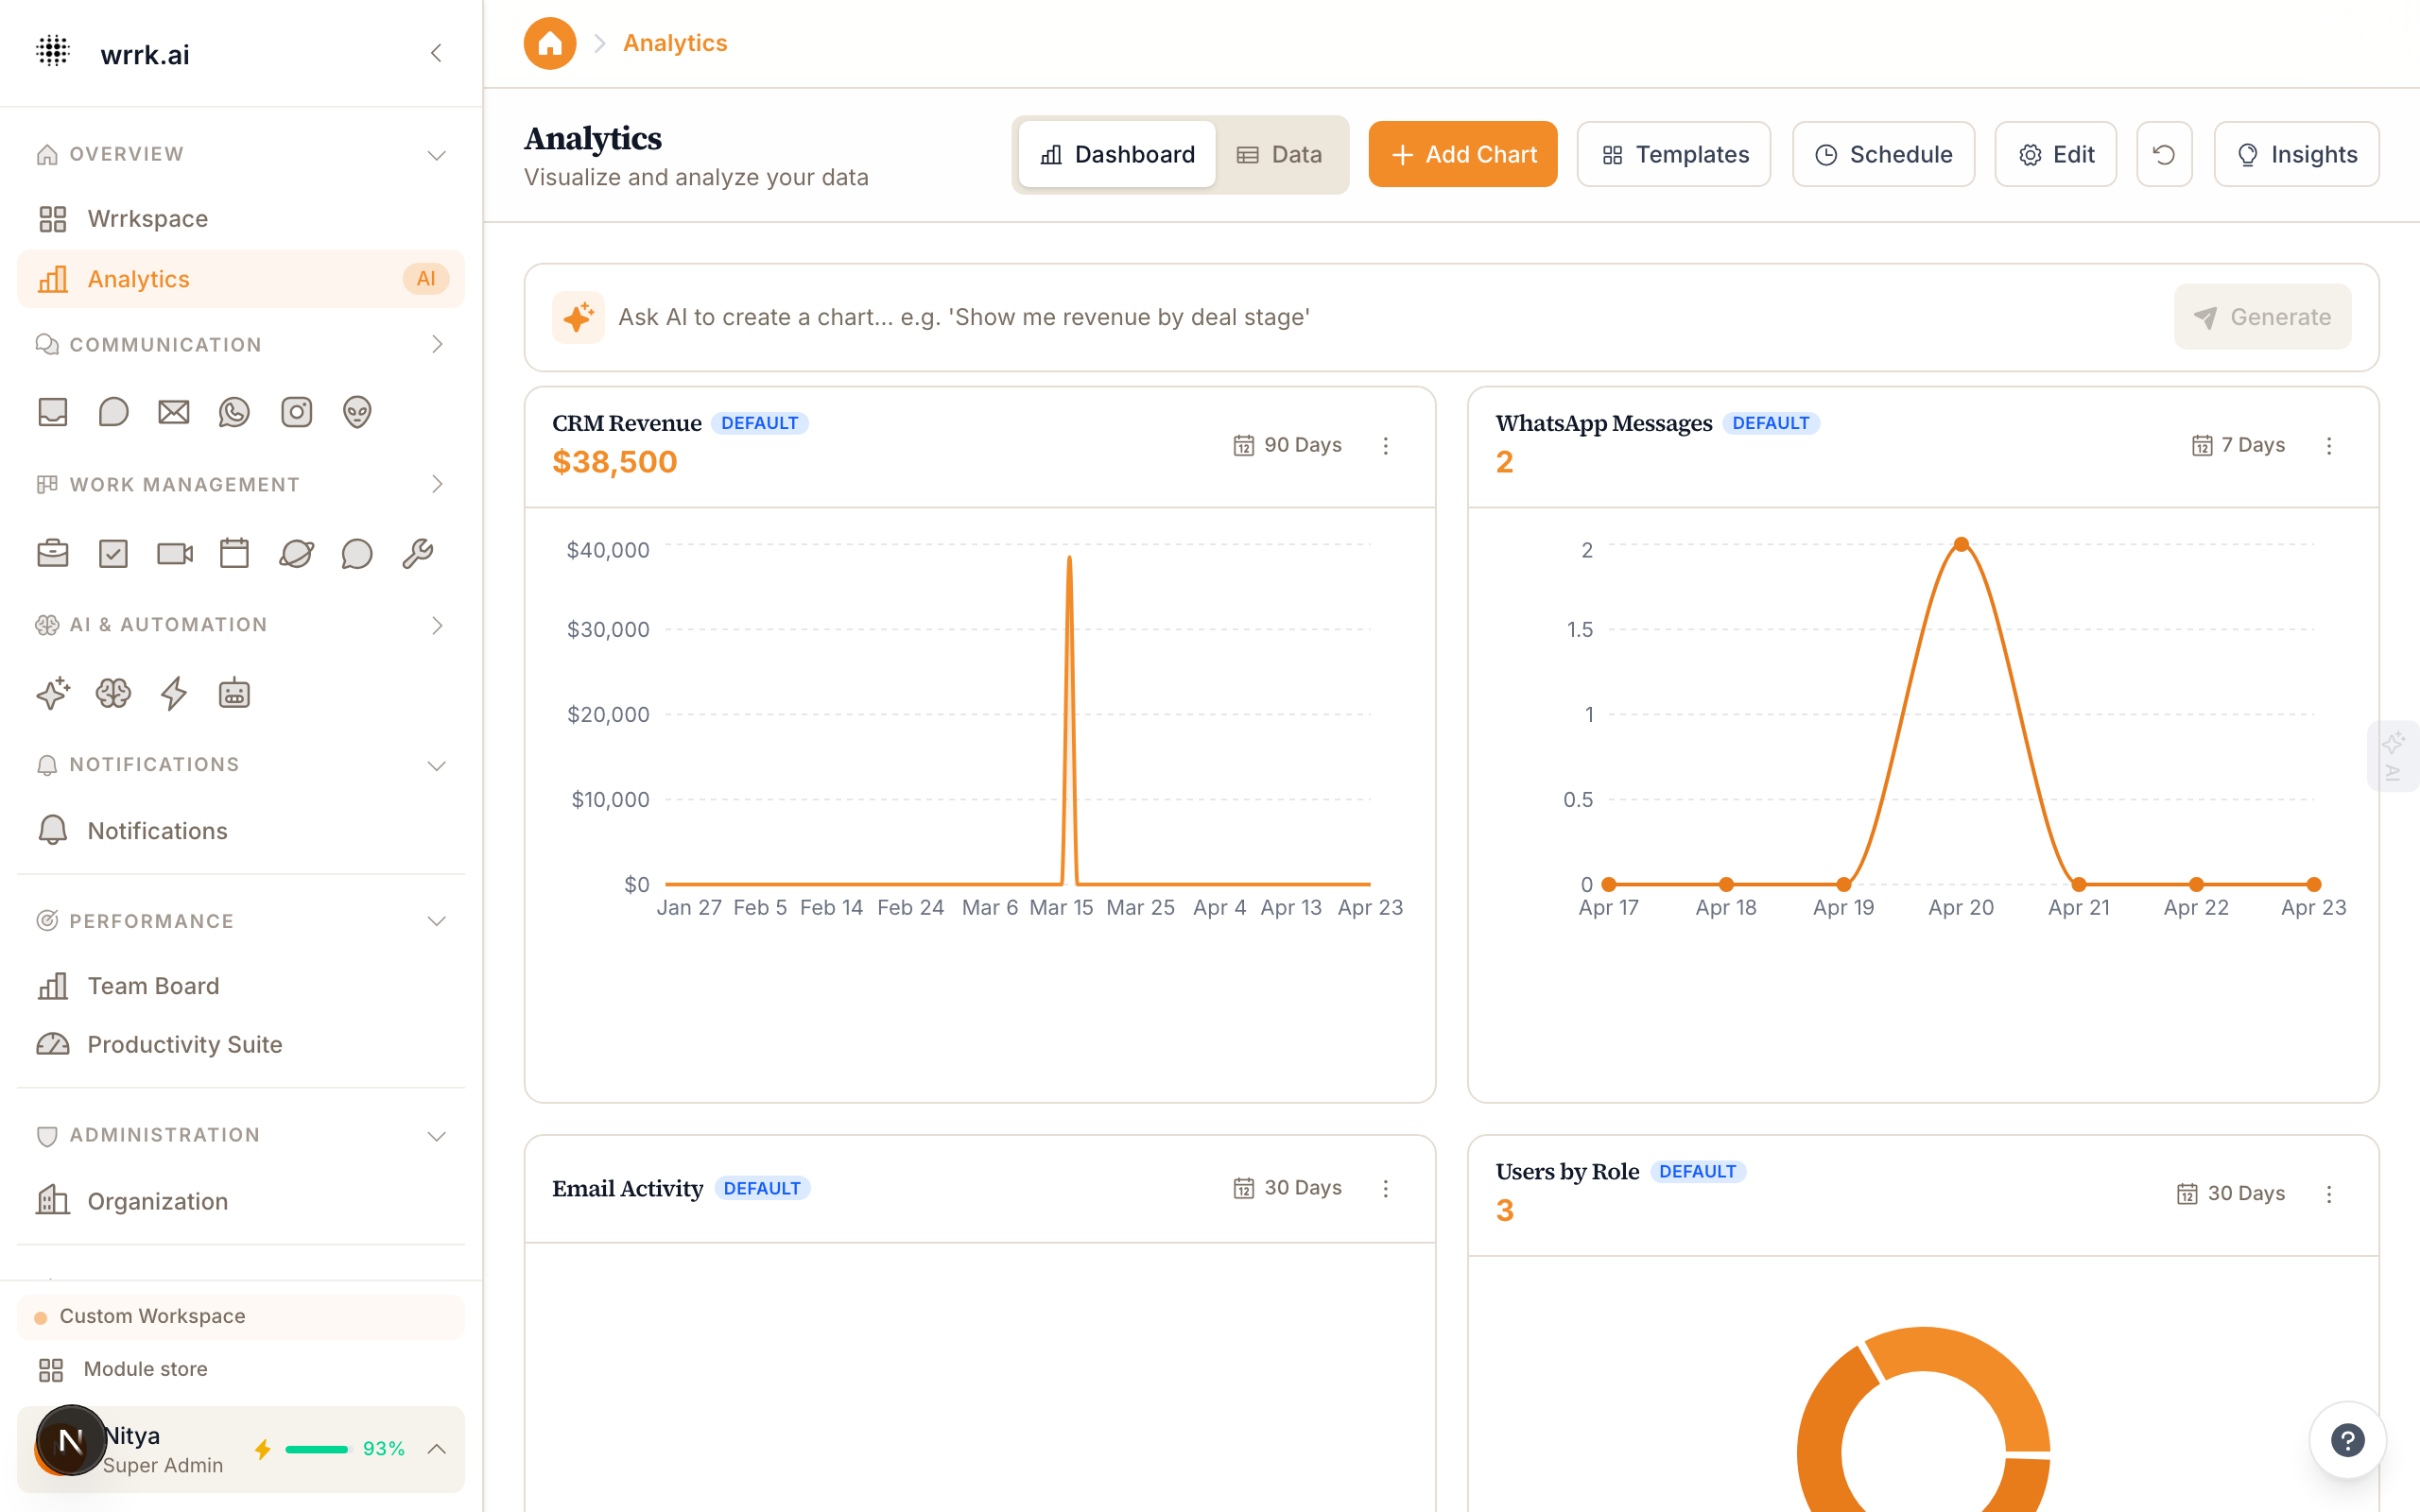
The Analytics module provides detailed insights into your team's performance, customer engagement, and business metrics.
Accessing Analytics
Click Analytics in the sidebar (under Overview). The analytics dashboard aggregates data from all connected modules.
Dashboard Sections
Communication Metrics:
- Total messages sent and received (across all channels)
- Average response time
- Response time distribution (histogram)
- Busiest hours and days
CRM Metrics:
- New contacts this period
- Deals created and closed
- Pipeline value trend
- Win rate over time
Team Performance:
- Messages handled per team member
- Average response time per team member
- Customer satisfaction scores per team member
- Activity heatmap
AI Performance:
- AI credits consumed
- AI suggestion acceptance rate
- Chatbot resolution rate
- Topics handled by AI vs. humans
Filtering
Use the filters at the top of the dashboard:
- Date Range: Select a predefined range (Today, This Week, This Month, This Quarter) or custom dates.
- Team Member: Filter to a specific person.
- Channel: Filter by email, WhatsApp, Instagram, etc.
- Department: If your org has departments configured.
Custom Reports
Build custom reports:
- Click New Report.
- Select metrics and dimensions.
- Choose a chart type (line, bar, pie, table).
- Save the report for future reference.
- Schedule automatic email delivery (daily, weekly, monthly).
Exporting
All charts and tables can be exported as:
- CSV: Raw data for spreadsheet analysis.
- PDF: Formatted report for presentations.
- Image: PNG of the chart for embedding elsewhere.
Tips
- Set up a weekly scheduled report delivered to your email every Monday morning.
- Compare time periods (e.g., this month vs. last month) to identify trends.
- Use the Team Performance view during 1:1s with team members.
Tags
analyticsreportsmetricsperformancedashboard