User Guide
Updated 2026-03-12
CRM Dashboard Overview
Navigate the CRM dashboard with metrics, charts, and AI insights.
CRM Dashboard
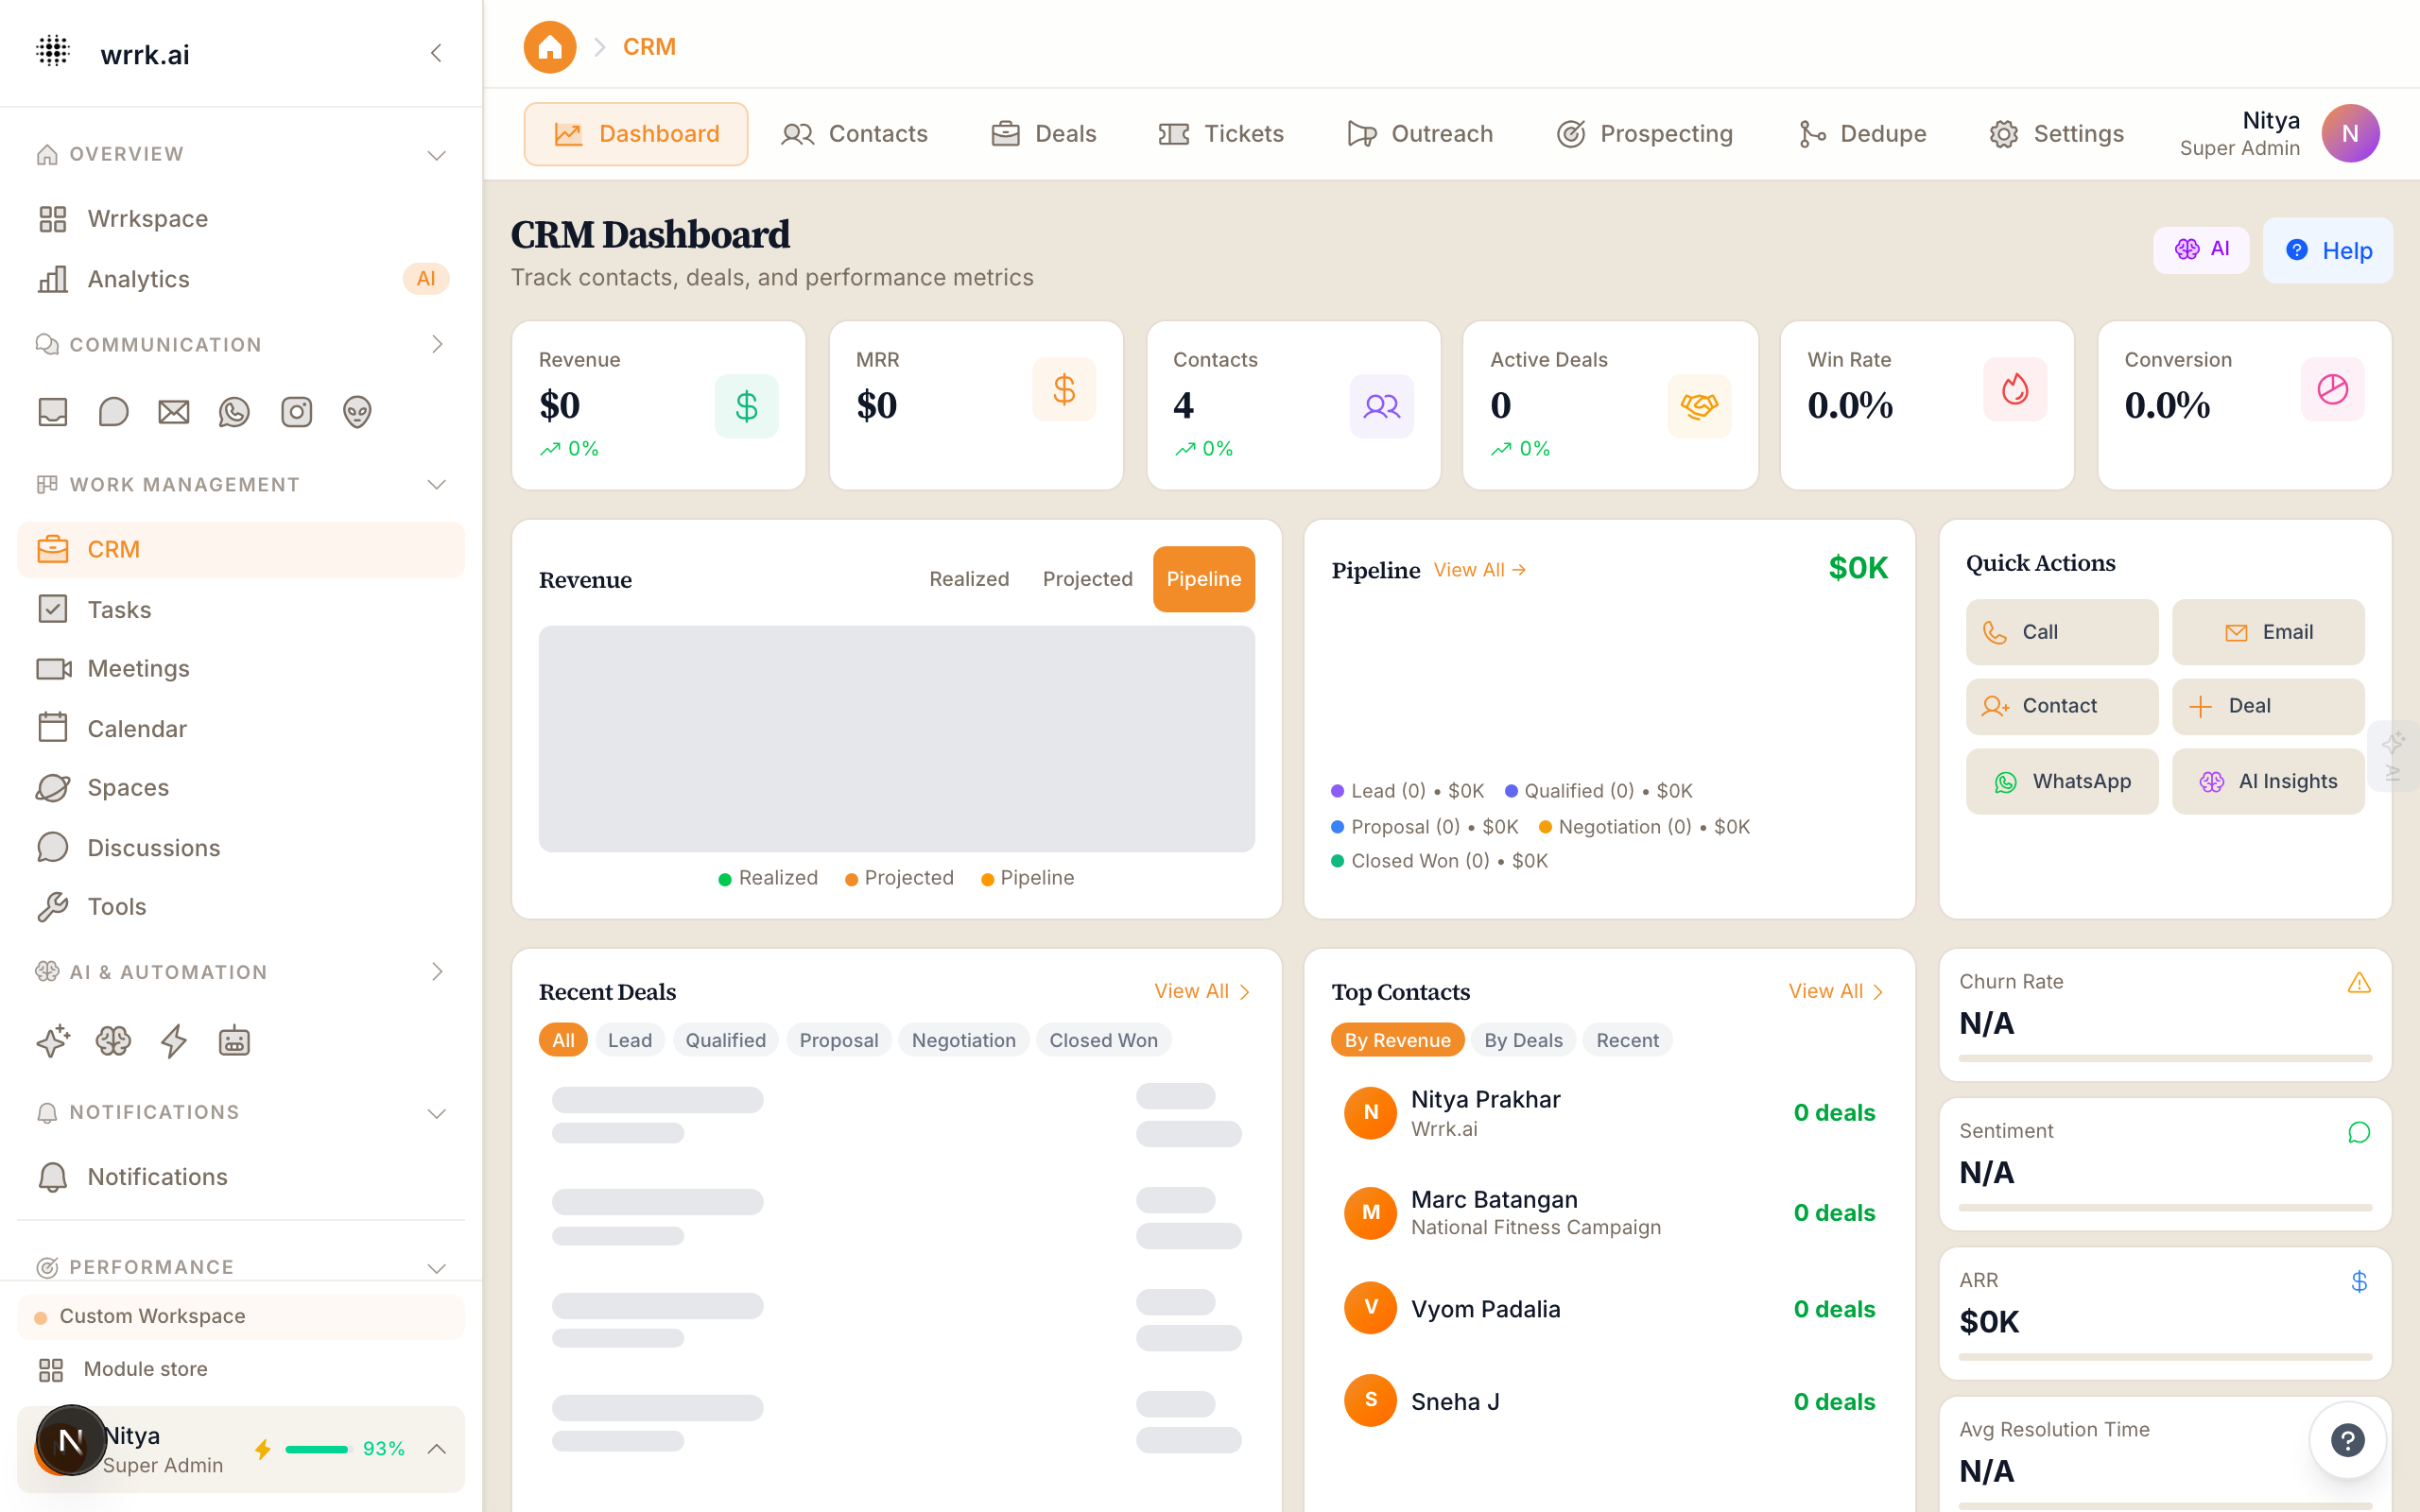
The CRM Dashboard provides a high-level view of your sales and customer relationship health. It is the first thing you see when navigating to the CRM module.
Key Metrics
The dashboard displays six primary metric cards:
- Total Contacts: The total number of contacts in your CRM.
- Active Deals: Number of deals in non-closed stages.
- Pipeline Value: Sum of all active deal values.
- Revenue This Month: Total value of deals closed as Won this month.
- Win Rate: Percentage of closed deals that were Won.
- Avg Response Time: Mean time to first response across all channels.
Revenue Chart
A line chart shows revenue trends over the past 12 months, computed from closed-won deals. Hover over any point to see the exact amount. Toggle between monthly and weekly views.
Recent Activity
A feed of the latest CRM actions:
- New contacts created
- Deals moved between stages
- Tasks completed
- Notes added
AI Insights Panel
The AI insights panel at the bottom of the dashboard surfaces:
- At-Risk Deals: Deals that have been stalled or show signs of going cold.
- Hot Leads: Contacts with high engagement scores.
- Suggested Actions: AI-recommended next steps for your most important deals.
Quick Actions
Buttons for common tasks:
- Create Contact: Opens the new contact form.
- Create Deal: Opens the new deal form.
- Send Email: Opens the email composer.
- WhatsApp Message: Opens the WhatsApp quick send modal.
Customization
The dashboard layout can be customized from CRM > Settings > Dashboard:
- Show/hide metric cards
- Change the time range for charts
- Pin specific widgets to the top
Tags
crmdashboardmetricsanalytics